[Webinar] Harnessing the Power of Data Streaming Platforms | Register Now
Announcing Elastic Data Streams Support for Confluent’s Elasticsearch Sink Connector
Get started with Confluent, for free
Watch demo: Kafka streaming in 10 minutes
Today, as part of our expanded partnership with Elastic, we are announcing an update to the fully managed Elasticsearch Sink Connector in Confluent Cloud. This update allows you to take advantage of a new indexing strategy from Elasticsearch known as data streams. An Elastic data stream lets you store append-only time series data across multiple indices while giving you a single named resource for requests. It is an abstraction on top of regular indices, which stores data in hidden indices. With this new update, Confluent’s Elasticsearch Sink Connector can read data from Apache Kafka® topics and write them to Elasticsearch data streams.
Confluent’s Elasticsearch Sink Connector offers the following benefits:
- Improved flexibility by having the option to create different data streams based on the data type (e.g., logs and metrics) and namespace. This offers more flexibility in storing and managing the growing amounts of data in Elasticsearch indices.
- Granular control of data by having the flexibility to split data based on data set and namespace, providing granular control on rollover, retention, and security permissions.
Demo scenario: Security information and event management (SIEM) use case
To better understand the data streams supported in Elasticsearch Sink Connector, let’s use an example of a fictitious company called Health Corporation, which is in the business of hosting and managing electronic health records for various hospitals. They host various types of web servers, software load balancers, firewalls, and storage solutions as a part of their cloud infrastructure. They also host a lot of custom applications across various lines of business in the cloud.
Considering that they are hosting extremely sensitive data related to patients and their medical history, they have a huge responsibility to keep the data secure. Hence, they’ve decided to implement a SIEM solution.
Challenge
While implementing a SIEM solution involves multiple challenges, we are going to focus on the following challenges faced by Health Corporation:
- Getting real-time visibility into all of the events happening across infrastructure, applications, and data storage services is a daunting task. Even though SIEM solutions offer a ton of built-in correlation to provide visibility into threats and attacks, these solutions are often not multi-cloud and hence the data exists in disparate silos. Complex pipelines to move data between clouds can result in delayed insights. Lack of real-time visibility across all the events prevents Health Corporation from detecting malicious activities in their network and taking immediate action on them.
- The lack of an efficient way to store and manage ingested data based on the type of data creates multiple challenges.
- As the data grows over time, it becomes difficult to tune, scale, and manage the backend storage services used for analytics and enterprise search.
- If all types (logs, metrics, and other types) of datasets (data from infrastructure, applications, and other services) are stored in a single backend storage, it often impacts performance of search and analytics queries. Mundane tasks, like simple searches, can take hours to complete.
Solution
- Health Corporation decides to build a SIEM solution composed of Confluent Cloud and Elasticsearch Cloud. After capturing the logs, metrics, and other types of time series data into Kafka topics within Confluent Cloud, they plan to leverage the fully managed Elasticsearch Sink Connector to write that data as data streams within Elasticsearch Cloud.
- Instead of writing all of the logs and metrics data into a single backend resource, they decide to create different data streams in Elasticsearch based on the type (logs, metrics, etc.) of the data and data set (data from the web server and firewalls).
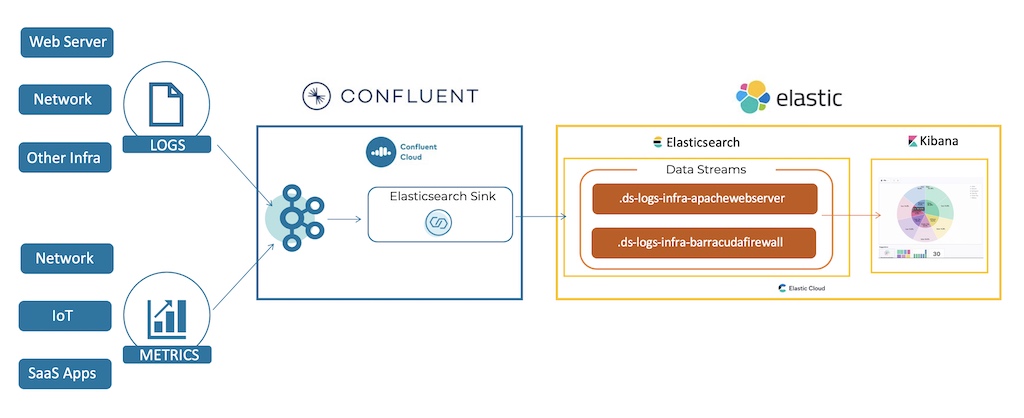
The diagram shown below provides a high-level overview of the solution. In this scenario, time series based events data from web servers and network firewalls is captured in two different topics in a Kafka cluster within Confluent Cloud. Confluent’s fully managed Elasticsearch Sink Connector then reads this data and securely writes it to Elasticsearch Cloud as two different Elastic data streams based on the type, dataset, and namespace configured within the connector.
Let’s do a walkthrough of some of the key steps followed by Health Corporation to deploy a successful SIEM solution across Confluent Cloud and Elasticsearch Cloud.
Step 1: Capture logs, metrics, and other types of event-based data in Kafka topics
There are multiple ways in which Health Corporation can capture event-based time series data into Kafka topics within Confluent Cloud. They can use various connectors to put the data at rest into data in motion by pushing it into Kafka topics. Data from those Kafka topics can then be sent to Elasticsearch for search, analysis, anomaly detection, and dashboarding. If the data is stored in AWS CloudWatch, they can use Confluent’s self-managed AWS CloudWatch Logs Connector to read data from AWS CloudWatch and write it to Kafka topics within Confluent Cloud.
For this demo, we will be using Confluent’s fully managed Datagen Source Connector to populate events-based time series sample data into the topics.
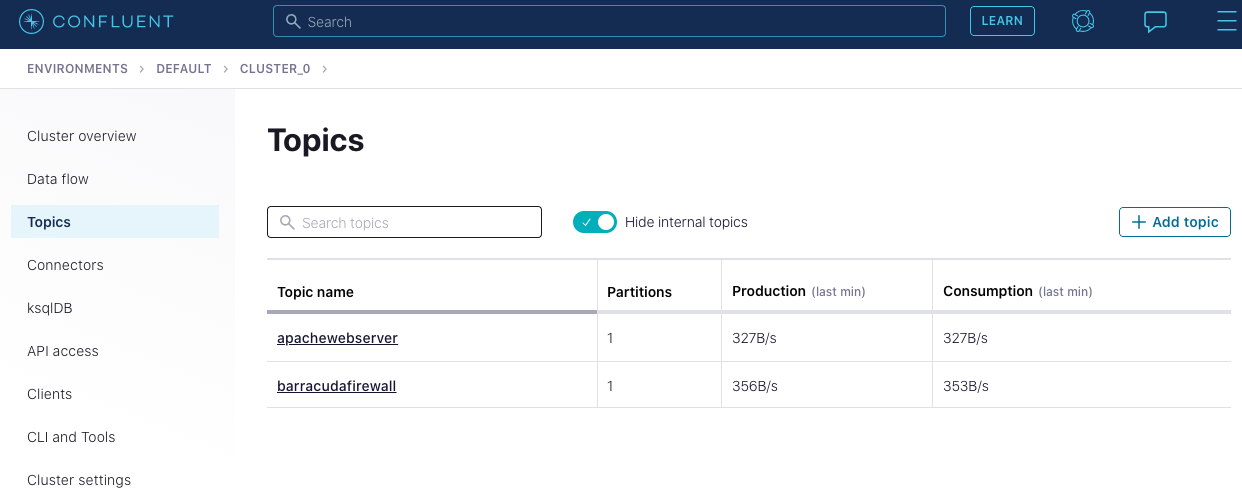
Log in to Confluent Cloud and create two topics in your Kafka cluster, apachewebserver and barracudafirewall, to capture log data from Apache HTTP Server and Barracuda CloudGen firewall.
After the two topics apachewebserver and barracudafirewall are created, you can see them on your “Topics” page:
Next, we’ll use the fully managed Datagen connector to populate data in the apachewebserver topic, then follow the same steps to populate the barracudafirewall topic.
Step 2: Read data from Kafka topics and write them as different data streams within Elasticsearch Cloud
Once the data is in Kafka topics, Health Corporation can configure and launch Confluent’s fully managed Elasticsearch Sink Connector in Confluent Cloud. The Elasticsearch Sink connector reads data from multiple topics and writes them as different data streams within Elasticsearch Cloud based on the type of data and data set. Let’s walk through how Confluent’s fully managed Elasticsearch Sink Connector can be configured to write to data streams.
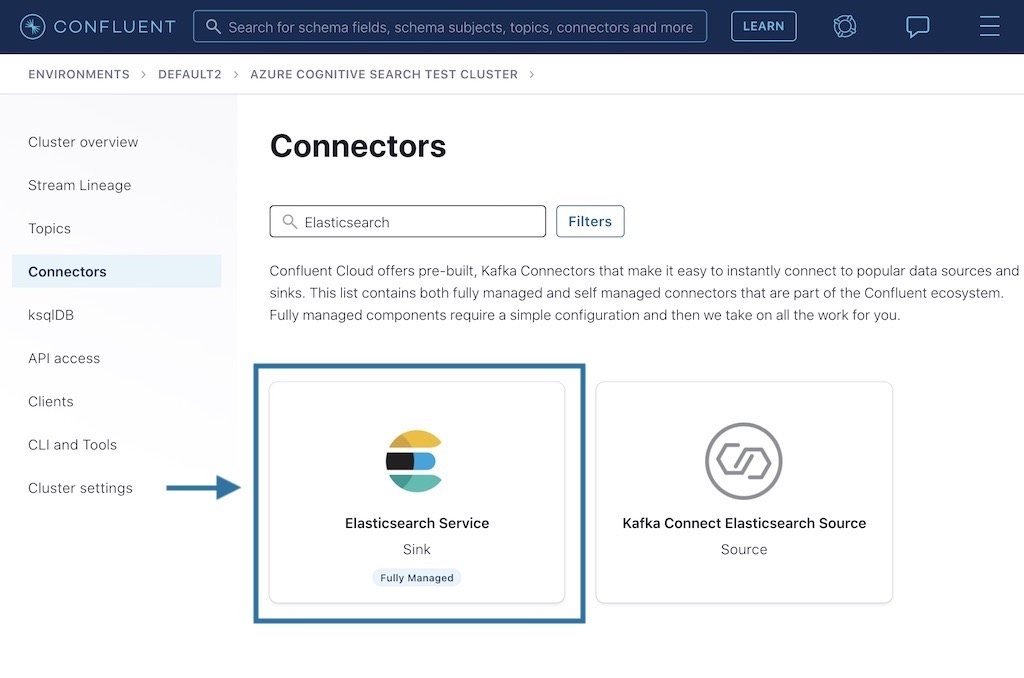
After logging into Confluent Cloud, click on Connectors on the left hand side and search for “Elastic.” Select the Elasticsearch Service Sink Connector, which is marked as “Fully Managed.”
Next, configure the Elasticsearch Sink Connector so that the two topics created in step 1 can be written to Elasticsearch as two different data streams. Below is a quick walkthrough of the steps.
Fill in all of the configurations as detailed below before launching the connector. You can also look at the configurations listed in the code snippet section.
- What topics do you want to get data from?
- Enter the topics (apachewebserver and barracudafirewall) from where you want to read and ingest data into Elasticsearch as different data streams.
- Input messages
- Enter the input message format. In this demo, we are using JSON as the input format, but you could use any format.
- Enter cluster credentials
- Enter the Kafka cluster credentials.
- How should we connect to your Elasticsearch Service?
- Enter the Elasticsearch Cloud credentials (URL, username, and password).
- Data conversion
- Because this demo uses JSON as the input format, we will mark Schema Ignore = true. Leave default values in the other configs by not entering anything.
- Error handling
- For this demo, leave everything as the default in the “Error Handling” section.
- Connection details
- For this demo, leave everything as the default in the “Error Handling and Connection Details” section.
- Number of tasks for this connector
- For this demo, mark the value as “1.”
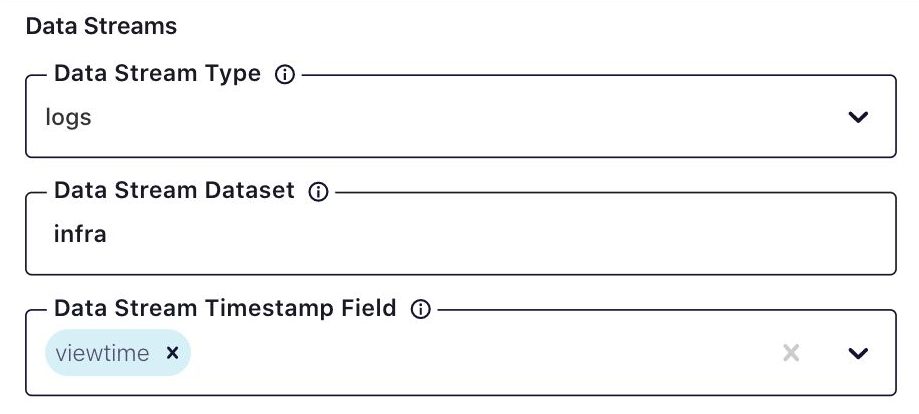
- Data streams: This is the section that allows you to configure Elasticsearch Data Streams.
- Type: Select logs from the dropdown. In this demo, we are assuming that Health Corporation is reading Apache HTTP Server and Barracuda CloudGen Firewall logs, hence we are selecting logs as the type. You can also select metrics if you have any metrics-related data.
- Data set: In this demo, we are treating this data set as infrastructure-related data and are giving it an appropriate name called infra. This value can be any string, which you would like to use to represent your data set.
- Timestamp field: This configuration is optional. If you leave this config empty, the connector will take a Kafka timestamp while reading data from the Kafka topic. Because we have populated data using Confluent’s fully managed Datagen Source Connector in Confluent Cloud, we are setting it to a timestamp field (viewtime), which is available in both the topics (apachewebserver and barracudafirewall).
Once you enter all the configurations and click on Next button, the code configurations will be displayed as shown below:
{
"name": "siem-monitoring",
"config": {
"topics": "apachewebserver, barracudafirewall",
"input.data.format": "JSON",
"connector.class": "ElasticsearchSink",
"name": "siem-monitoring",
"connection.url": "https://<host>:<port>",
"connection.username": "<username>",
"schema.ignore": "true",
"tasks.max": "1",
"data.stream.type": "logs",
"data.stream.dataset": "infra",
"data.stream.timestamp.field": "viewtime"
}
}
Once all of the configurations are entered properly, click Next and then click Launch to launch the connector. The connector first goes into the “Provisioning” state, and then once the connector is running successfully, it will display the “Running” state.
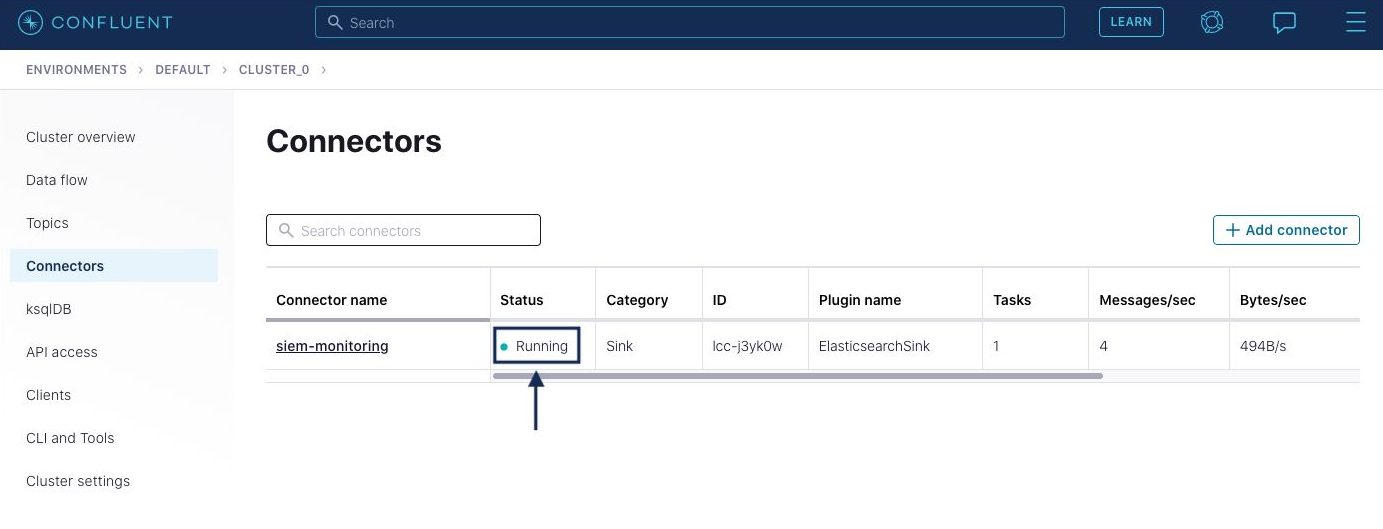
After the connector starts reading data from the topics, it will display the number of processed messages on the connector page. Click on the connector name shown in the picture above to navigate to the detailed connector page.
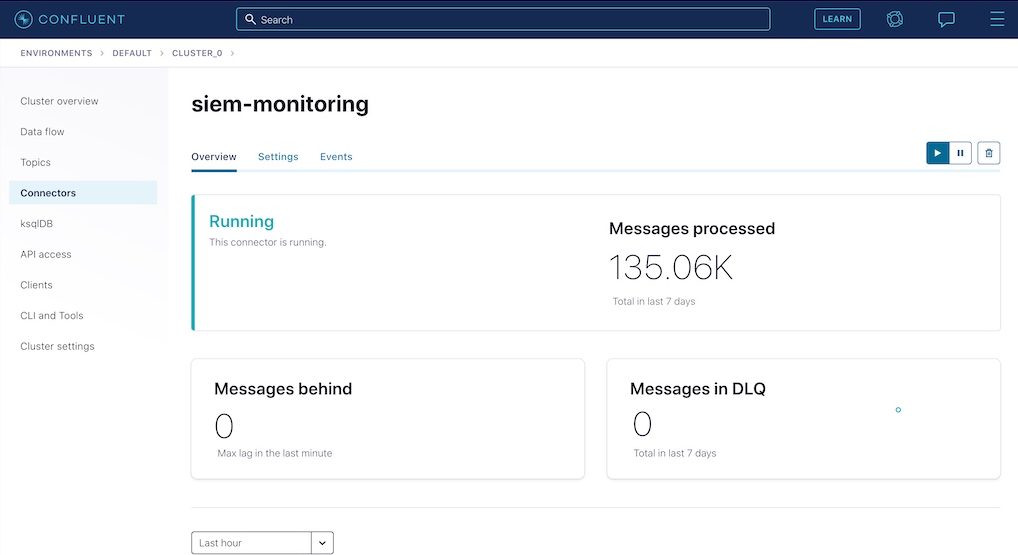
This completes all of the steps that need to be performed within Confluent Cloud. In the next step, we’ll validate that the data streams have been created in Elasticsearch Cloud by the Elasticsearch Sink Connector.
Step 3: Build Kibana dashboards to get real-time visibility into any malicious activities
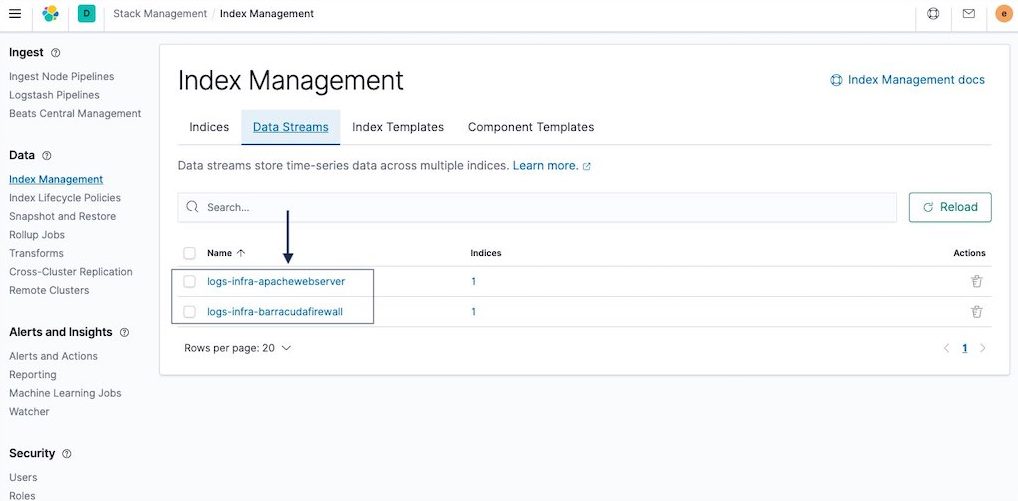
Developers and operators can log in to Elasticsearch Cloud and launch Kibana. Navigate to Home > Stack Management > Index Management. On the “Index Management” page, click on the Data Streams tab as shown in the picture below. It should display the two data streams created by the Elasticsearch Sink connector in step 2.
The Elasticsearch Data Streams functionality uses the following naming convention:
Format: type-dataset-namespace
- type: Supports two values, logs and metrics.
- dataset: Generic string that represents your data. For example “infrastructure” or ”infra.” It can be any string value.
- namespace: This is the name of the source topic from where data is being read by the connector. You can select multiple topics.
Example 1: logs-infra-apachewebserver
- type=logs
- dataset=infra
- namespace=apachewebserver
Example 2: logs-infra-barracudafirewall
- type=logs
- dataset=infra
- namespace=barracudafirewall
The flexibility to configure the type of data, dataset and namespace allows you to easily create different data streams instead of storing all the data in one Elasticsearch Index.
After ensuring the data is getting populated into Elasticsearch data streams, the Health Corporation team decides to build a dashboard using Kibana to get real-time visibility into threat detection and anomalies across all of their applications and infrastructure.
Building a dashboard in Kibana is a three-step process:
1. Create an index pattern
The Health Corporation team creates an index pattern, which lets them query and filter all the indices based on a prefix. Since this scenario is talking about Elasticsearch Data Streams, which are stored as hidden indices, you have to ensure that you enable the option to view hidden indices by checking the option to Include system and hidden indices.
In this example, the index pattern name is set to .ds-logs-infra-*, which matches the two data streams related to Apache HTTP Server logs and Barracuda CloudGen Firewall logs.
Once the index pattern is created, the Health Corporation team does a quick test by using the Discover functionality to ensure the index pattern is returning the right type of data from the underlying indices of the data streams.
2. Build visualizations
In this step, the Health Corporation team builds a visualization based on the index pattern created in the previous step.
Navigate to Home > Visualize > Create Visualization, and create your visualization as shown below. Ideally, this visualization provides real-time visibility into any anomalies detected during the user logins or user interactions, but because we are using sample data in this example, we will just be displaying user information in a pie chart.
3. Add visualizations to dashboard
In this step, the visualization is added to a dashboard.
This concludes the final step of the demo. Health Corporation now has a SIEM system up and running across Confluent Cloud and Elasticsearch Cloud.
Summary
In this example, we saw how Health Corporation accomplished the following:
- Built a SIEM solution, which leveraged the fully managed Elasticsearch Sink Connector from Confluent Cloud to Elastic Cloud. This led to real-time visibility across all the events happening in their infrastructure.
- Health Corporation could configure the Elasticsearch Sink Connector to write different types of data sets (Apache HTTP Server and Barracuda CloudGen Firewall logs) as separate data streams within Elastics Cloud. This led to improved operational efficiency with index management.
If you’d like to do the same as well, you can get started by signing up for a free trial of Confluent Cloud and start using the Elasticsearch Sink Connector or any other fully managed connector. You can use the promo code CL60BLOG for an additional $60 of free usage.*
Get started with Confluent, for free
Watch demo: Kafka streaming in 10 minutes
Ist dieser Blog-Beitrag interessant? Jetzt teilen
Confluent-Blog abonnieren


Schema Registry Clients in Action
Learn about the bits and bytes of what happens behind the scenes in the Apache Kafka producer and consumer clients when communicating with the Schema Registry and serializing and deserializing messages.

How to Securely Connect Confluent Cloud with Services on Amazon Web Services (AWS), Azure, and Google Cloud Platform (GCP)
The rise of fully managed cloud services fundamentally changed the technology landscape and introduced benefits like increased flexibility, accelerated deployment, and reduced downtime. Confluent offers a portfolio of fully managed...